Click image below to enlarge
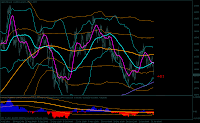
The analysis begins by looking GU travel through MA and BB tools. In our 4H TF pairs BB and MA 480 (4 Monthly) Orange color. SD wieghted price 1dan 2. Plus MA 120 (monthly) colors Aqua, MA 30 (Weekly) Magenta color, and MA in 1440 (Yearly) SlateBlue color.
Prices seen moving towards the conditions in BB Ubnormal reference 4 months, after repeated in a normal condition in the reference month. MA per week also had been under the MA monthly, may have initiated the movement down. But with Yearly MA condition was UP and also 4 months still look flat as we can conclude that prices will go back into normal conditions in reference 4 monthly.
Click image below to enlarge
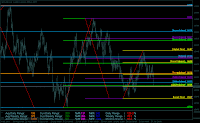
Then we see also travel using KG BSBands GU. We have 4 pairs KGBSBands Monthly, yearly BSbands, LSMA 4Bulanan, LSMA Yearly and Monthly LSMA. Visible power-seller 4 Monthly has been mastered, it is marked with the price through the Lower BSbands (Seller balance) BSbands 4 monthly. Power of Buyers also began to weaken in BSbands yearly with the entry price into the area and BS Buyer Balance balances. If the price into the price balance Buyers will tend toward the area of TF Balance. This is reinforced by 4 monthly and LSMA Monthly LSMA. But we also see the start tend LSMA Yearly sloping and downward. However, yearly LSMA KG has not entered an area that shows the yearly BSBands prices opportunities to UP still exist.
Click image below to enlarge
Viewed from KGBalance manual, we see the final price is still stuck in the Seller Balance area. If prices break this area likely will lead to lowest price or will form the new lowest. But if the price in 1-2 days still in the area then it is likely the price will go to his balance area.
May help, good n Got Green Trading Huh


No comments:
Post a Comment