iklan

Showing posts with label analisa. Show all posts

Sunday, March 27, 2011

EU and GU Analysis for Next Week Trade


EU analysis
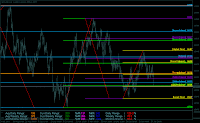
My analysis said that maybe EU will ranging for next week, there is high usage area at low and high and my prediction EU will fill Low usage area. if it has filled then she will move to Value area, perhaps this month POC.


GU analysis
We can see S/D clearly with Market Profile help. So next target is 1.6142 and maybe it will move to this month High point ^^

Sunday, January 31, 2010

GBPUSD for Next week

Click image below to enlarge

fullmetalfx.blogspot.com

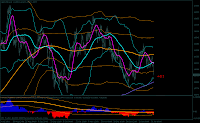
The analysis begins by looking GU travel through MA and BB tools. In our 4H TF pairs BB and MA 480 (4 Monthly) Orange color. SD wieghted price 1dan 2. Plus MA 120 (monthly) colors Aqua, MA 30 (Weekly) Magenta color, and MA in 1440 (Yearly) SlateBlue color.
Prices seen moving towards the conditions in BB Ubnormal reference 4 months, after repeated in a normal condition in the reference month. MA per week also had been under the MA monthly, may have initiated the movement down. But with Yearly MA condition was UP and also 4 months still look flat as we can conclude that prices will go back into normal conditions in reference 4 monthly.
Click image below to enlarge

fullmetalfx.blogspot.com

Then we see also travel using KG BSBands GU. We have 4 pairs KGBSBands Monthly, yearly BSbands, LSMA 4Bulanan, LSMA Yearly and Monthly LSMA. Visible power-seller 4 Monthly has been mastered, it is marked with the price through the Lower BSbands (Seller balance) BSbands 4 monthly. Power of Buyers also began to weaken in BSbands yearly with the entry price into the area and BS Buyer Balance balances. If the price into the price balance Buyers will tend toward the area of TF Balance. This is reinforced by 4 monthly and LSMA Monthly LSMA. But we also see the start tend LSMA Yearly sloping and downward. However, yearly LSMA KG has not entered an area that shows the yearly BSBands prices opportunities to UP still exist.
Click image below to enlarge

fullmetalfx.blogspot.com

Viewed from KGBalance manual, we see the final price is still stuck in the Seller Balance area. If prices break this area likely will lead to lowest price or will form the new lowest. But if the price in 1-2 days still in the area then it is likely the price will go to his balance area.

May help, good n Got Green Trading Huh

Tuesday, November 3, 2009

Complete Strong signal Buy With Ichimoku

Click image below to enlarge

fullmetalfx.blogspot.com

@ picture above you can see, complete strong signal buy @USDCHF by Ichimoku.
Here is explaination:
1. Cross Ts and Ks
2. Price is above Kumo
3. Chikou Span above price
4. and also switch kumo from downtrend to uptrend

Lets see..

Friday, October 23, 2009

S/R position with Chikou Span of Icihimoku

Click image below to enlarge

fullmetalfx.blogspot.com

I try to make S/R point based on Ichimoku Kinko Hyo. I put its S/R level on Chikou Span, as you see on Picture above. Then i decide to make Pending Order based on Moving Up of daily Chart. So I take Buy Limit on Support Level..

Lets see..

Sunday, October 4, 2009

GU Analysis forcase next week based on KG Level

Click image below to enlarge

fullmetalfx.blogspot.com

See picture above. I have tried to mapping GU track using KG level. I love this method, nice KG..
Based on picture above I have decide that level Balance @1.5943 and Balance @1.5961 is my critical level.
If she cant thru Balance level @1.5943 i decide to take Sell position after make analysis on BB and MA @ TF 15M..
If she can thru Balance level @1.5961 i decide to take Buy position after make analysis on BB and MA @ TF 15M..

Lets Rock!!!

Wednesday, September 9, 2009

KG Level

Click image below to enlarge

fullmetalfx.blogspot.com

KG level made by Kang Gun, trader from Bandung, Indonesia. He is my favorite forex mentor. KG level made use Fibonacci retracement level, but by KG it has change and now it more powerfull. KG level discribe price wave. You can see it retrace or reversal. It also combine by elliot wave, but actually its KG wave...hehehe..
Here is Setup for Your Metatrader:
1. Insert Fibonacci Retracement to your chart (basically KG level put it from HIGH to LOW)
2. Click Fibonacci Retracement properties
3. Choose Fibo levels, now you see two colums "level" and "descriptions"
4. Errase level from the "level" colums until empty,
5. Fill "level" colums use this KG level below:
Level Descriptions
2.00 [SD +3.0] %$
1.75 [SD +2.5] %$
1.50 [SD +2.0] %$
1.25 [SD +1.5] %$
1.00 [SD +1.0] %$
0.75 [SD +0.5] %$
0.50 [BALANCE] %$
0.25 [SD -0.5] %$
0.00 [SD -1.0] %$
-0.25 [SD -1.5] %$
-0.50 [SD -2.0] %$
-0.75 [SD -2.5] %$
-1.00 [SD -3.0] %$
6. Click OK, now you get the KG level hehe...

How to use?
After edit your Fibo retracement, now you can use KG level by put it to your chart based on HIGH price to LOW price from your chart. You can see from my example picture above...

From KG level you can describe the price movement based on:
- Retrace small, retrace happens when the price moves by 0.5% from the peak or valley 1 / 2 the previous wave.
- Retrace normal retrace happens when the price reaches Balance moved from the top or from the valley.
- Retrace Medium, retrace that occurs when the price moves of 1.5% from the peak or valley 1 / 2 the previous wave.
- Retrace the Great, retrace what happened when the price moves of 2% better than the peak or valley 1 / 2 the previous wave and in other words the price back to the peak or valley value 1 / 2 the previous wave.

Then we define the Reversal if the price moves more than 2% better than the peak or valley 1 / 2 the previous wave.

Now, how do you think?

Sunday, August 23, 2009

Analisa KG dengan looking multi Time Frame

Click image below to enlarge..

fullmetalfx.blogspot.com


Gambar diatas adalah setup MT4 yg akan kita gunakan untuk menganalisa chart minggu depan.
Setupnya adalah:

1. Hapus semua chart di MT4 anda, lalu tambahkan chart hanya GBPUSD saja, dengan timeframe H4, H1, M30, dan M15.
2. H4 hanya ada BB Bulanan (periode 120) dengan 3 SD
H1 hanya ada BB Mingguan (periode 120) dengan 3 SD
M30 hanya ada BB Harian (periode 48) dengan 3 SD
M15 ada BB 8 jam-an (periode 32) dengan 3 SD, MA 4 jam-an dan MA 1 jam-an.
3. Tambahkan pula periode separator, caranya klik [chart]>properties>common>centang show period separators, ini untuk memperjelas pembagian waktu
4. Selanjutnya ikuti apa kata KG berikut:
H4, H1 dan M30 berfungsi sebagai Maps atau peta. Di ketiga chart tersebut kita mengumpulkan informasi pergerakan harga yang terjadi dilihat dari posisi harga terhadap SD +/- 1 (Normal atau Ubnormal), Bentuk Upper/Lower BB (Mengembang, Mengerucut atau datar), kemiringan middle BB (pointing up, pointing down atau datar) dan kondisi harga beberapa waktu kebelakang terhadap BB acuan tersebut.

M15 berfungsi sebagai tempat kita mengamati pergerakan harga selama periode 8 jam-an. Di M15 kita juga melakukan pengumpulan informasi sebagaimana yang kita lakukan di Chart H4, H1 dan M30. Di tambah kita juga mengamati pergerakan harga berdasarkan MA-MA pengarah 8 jam-an, 4 jam-an dan 1 jam-an (keadaan MA MA tersebut, posisinya terhadap satu sama lain etc).

Seluruh informasi tersebut akan anda gunakan untuk membuat keputusan dan menyusun strategy. Ketika anda posting, selalu sertai analisa dan strategy OP yang anda lakukan lengkap dengan TP pertama, kedua atau ketiga dan yang terpenting selalu sertai dimana anda menempatkan SL.

Saya harap biar pembelajaran ini berjalan dengan baik, temen posting gambarnya selalu gambar 4 chart .. tidak satu TF saja. Caranya gampang, pada saat anda mengclick Save as, pilih Active Workspace maka gambar chart anda akan di save seluruhnya...

semoga membantu semuanya,

KG


Dan terakhir dari saya, silakan pelajari apa yang KG maksudkan. Pahami, praktekkan dan backtest,,renungkan apa yang membuat kita win apa loss..